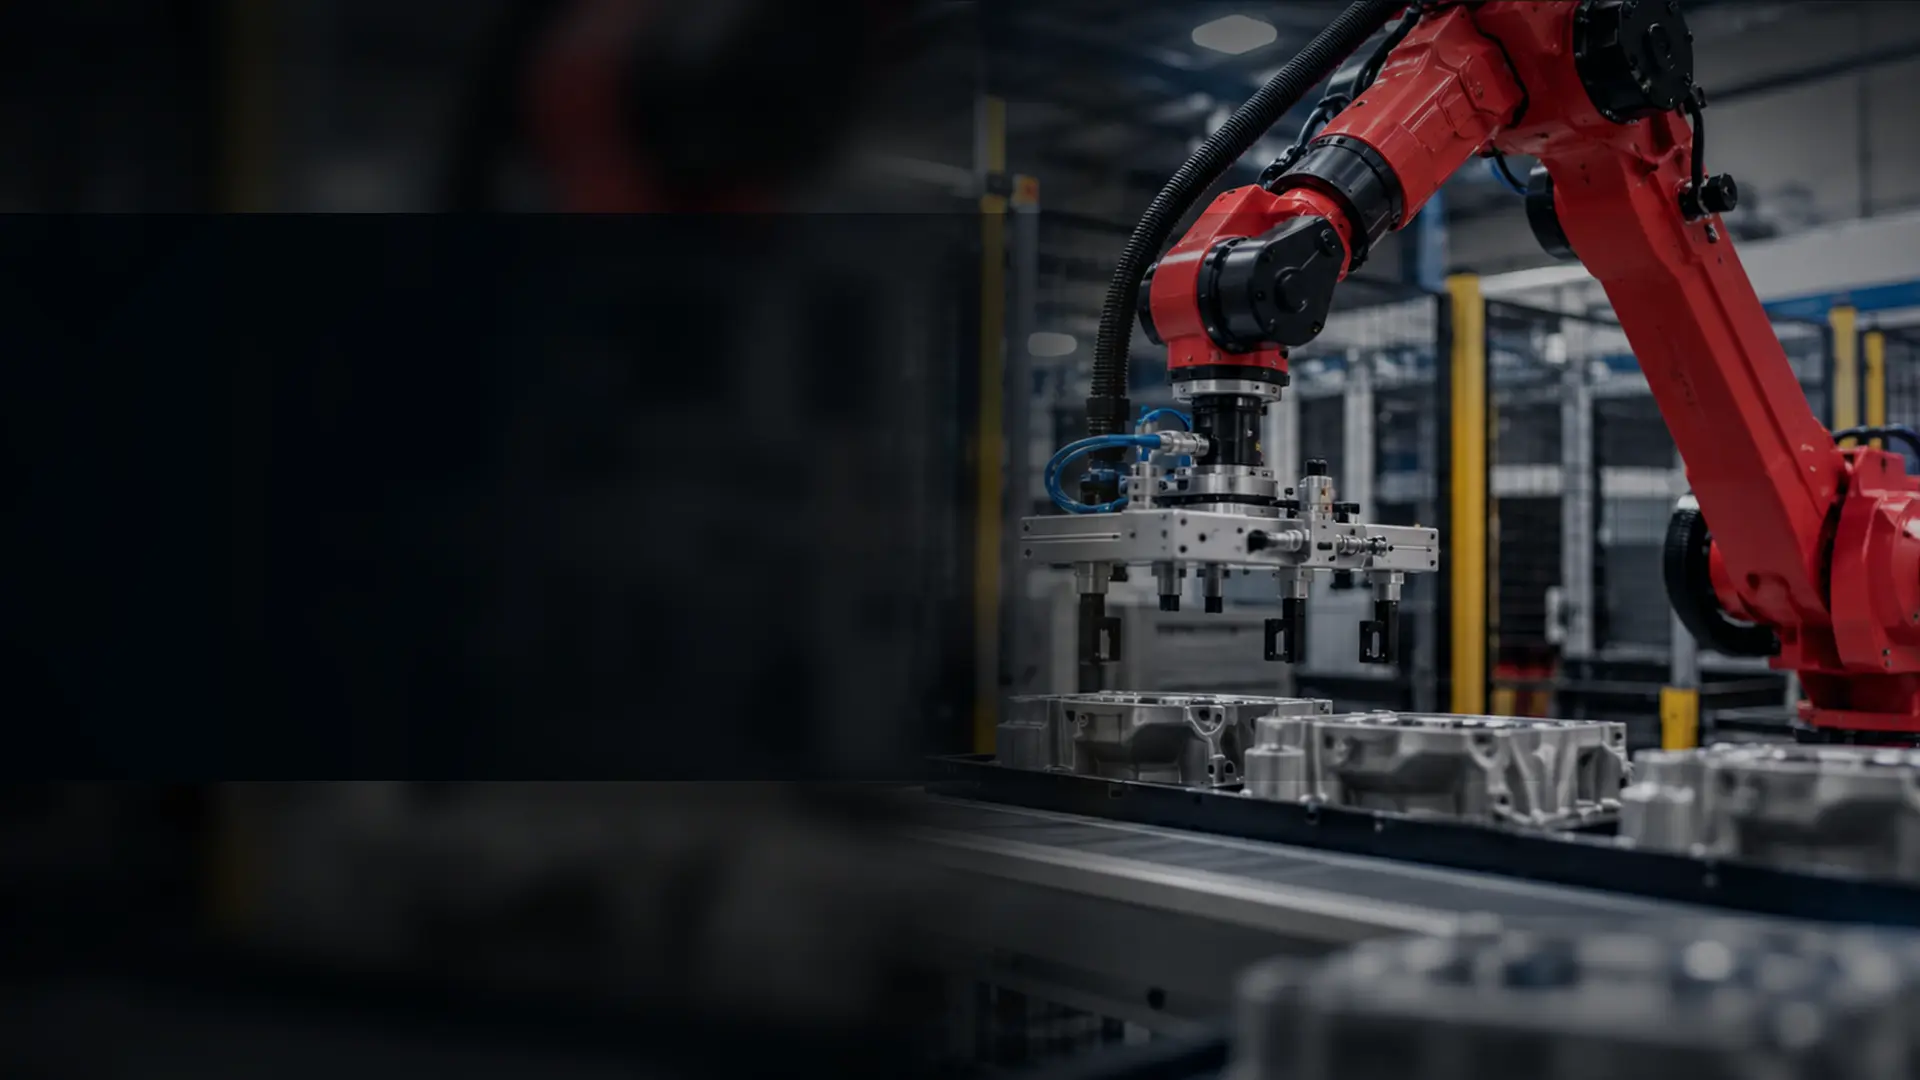
Injection moulding robot cost depends on the robot architecture and the complete scope needed to create a safe, working production cell. Calculate return on investment from the total installed cost and a conservative annual net benefit based on real production data. A robot price without EOAT, interfaces, guarding, product flow, commissioning and support is not a comparable project price.
What determines the installed cost?
| Cost area | Questions that change the scope |
|---|---|
| Robot or manipulator | Sprue picker, Cartesian/linear, side-entry, six-axis or cobot; payload; strokes; speed; wrist axes; controller and mounting. |
| End-of-arm tooling | Part and runner geometry, cavities, temperature, surface protection, sensors, utilities, quick change and insert handling. |
| Machine integration | Available robot interface, ejectors and cores, controller age, reject handling, recipes and production data exchange. |
| Downstream automation | Drop or conveyor, cooling, cavity separation, vision, trimming, assembly, counting, bagging, boxing, labelling or palletising. |
| Safety and access | Guarding, interlocks, safe access, maintenance positions, risk reduction measures and conformity scope. |
| Delivery | Design, build, programming, trials, documentation, installation, commissioning, training, spares and support. |
Two robots with a similar catalogue payload can produce very different installed costs because one application only needs runner removal while another needs a multi-cavity EOAT, vision checks, cooling conveyor and automatic packing hand-off.
How is injection moulding automation ROI calculated?
Payback period = total installed investment ÷ annual net benefitUse the same time and cost basis for every option. Annual net benefit should deduct ongoing maintenance, utilities, replacement wear parts and any added technical-support requirement.
Released or redeployed hours
Count only hours genuinely removed from repetitive attendance or transferred to productive work. Include shift pattern, cover, breaks and supervision realistically.
Additional saleable capacity
Value faster or more available production only where demand, downstream capacity and contribution per part support it.
Scrap and rework avoided
Use measured handling damage, mixed-cavity output, contamination, missed inserts or packing errors that the proposed checks can directly address.
Stops and waiting reduced
Quantify stoppages caused by manual unloading, variable attendance, full containers or inconsistent hand-off—then test whether the design removes the cause.
Secondary work eliminated
Include separate sorting, orientation, counting, degating or transfer operations only when they are genuinely integrated into the proposed cell.
Assumptions and sensitivity
Calculate a base case and a conservative case. Payback that depends on perfect uptime or unconfirmed future volume is not robust.
What production data should be collected?
- Annual scheduled and actual production hours by shift.
- Current cycle time and the time spent waiting for handling.
- Operator time allocated to unloading, separation and packing.
- Scrap, damage, rework and mixed-output costs linked to handling.
- Planned and unplanned downtime with recorded reasons.
- Demand and contribution available from any extra capacity.
- Changeover frequency, tooling changes and batch sizes.
- Maintenance, consumables, compressed air and support assumptions.
Separate verified facts from estimates. If a benefit is not measurable yet, agree how it will be tested during concept or trials rather than treating it as guaranteed savings.
Which projects create the strongest value?
Good candidates usually have a repeatable task, sufficient production hours, a stable moulding process and a handling constraint that automation can directly remove. The strongest case may be labour reduction, but it can also be quality protection, cavity traceability, higher machine availability, safer removal of hot or awkward parts, or the ability to connect moulding directly to packing.
Conversely, low annual volume, frequent uncontrolled product changes, an unstable moulding process or an undefined downstream destination can weaken the case. In those situations, standardising the process or designing flexible tooling may be more important than choosing a faster robot.
How do you obtain a comparable quotation?
Give each supplier the same application brief and ask for the same boundaries. A comparison should state what is included for robot, EOAT, machine interface, guarding, conveyors, controls, trials, installation, training, documentation, acceptance, spares and support. Note exclusions explicitly.
Ask how cycle performance will be proven, what product and mould samples are required, who owns each interface and what happens when a grip or placement check fails. Those answers affect production risk as much as the purchase price.
Cost and payback FAQs
01How much does an injection moulding robot cost?
A useful figure must cover the complete installed scope, not only the robot. Robot type and size, end-of-arm tooling, machine interface, guarding, conveyors, controls, validation, installation and training all change the cost. A firm quotation therefore needs the machine, mould, product, cycle and downstream requirement.
02How is robot payback calculated?
Simple payback is total installed investment divided by verified annual net benefit. Annual benefit can include labour released to other work, additional saleable output, reduced scrap and rework, avoided downtime and lower handling cost, less ongoing maintenance, utilities and consumables.
03Does a faster robot always improve ROI?
No. The moulding process may be limited by cooling, injection or another downstream operation. Faster robot motion creates value only when it removes a genuine constraint without compromising handling, safety, reliability or part quality.
04What information is needed for an automation ROI study?
Use actual annual production hours, labour allocation, cycle time, planned and unplanned downtime, scrap and rework, demand, contribution from extra capacity, maintenance cost and the full installed automation scope. Separate measured facts from assumptions and sensitivity-test the uncertain values.